
Still have questions?
Talk with our team
Product questions, pricing, or rollout — we'll get back within one business day.
Contact usMaterial prices
Quotr and Professor Iris D. Tommelein
Peer-reviewed research · Published November 2, 2026
AI material price forecasting, co-authored with UC Berkeley Distinguished Professor Iris D. Tommelein.
What will your materials cost when it is time to buy? Quotr’s published research brings construction cost histories and market signals together to forecast detailed material-category prices.
Developed through Quotr AI’s internal R&D and published in an ASCE flagship journal, the study connects original AI research with the decisions behind a bid, a budget, and a purchase.
1.60%
Median forecast error
Wood, Plastics, and Composites. Median category-level MAPE. Table 2.
22
CSI divisions
Construction-cost data organized across the published research dataset.
455
Material sections
11,185 material-bearing cost items. Data Description, pp. 4–5.
01 / Cross-trade data
From concrete and metals to electrical, HVAC, plumbing, and finishes. Quotr’s published research organizes construction-cost data across 22 CSI Divisions, 455 detailed material Sections, and 11,185 material-bearing cost items.
Different trades face different price movements. The study examines how costs move together across construction divisions, connecting individual material histories with a broader view of the market.
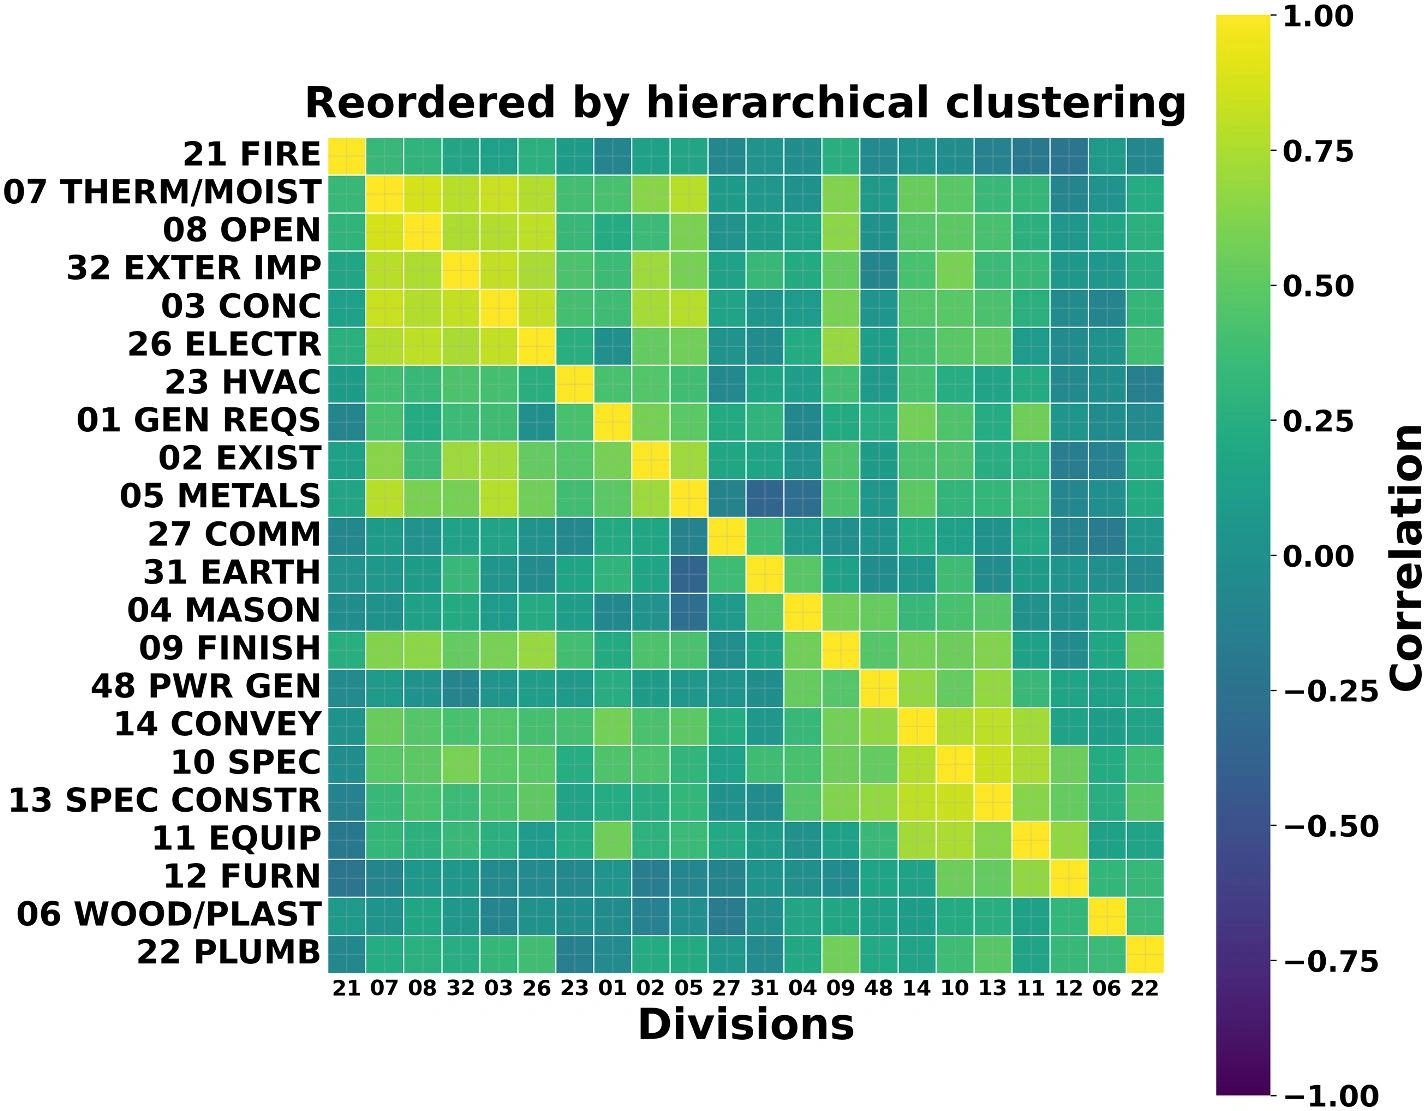
The research brings material-specific cost forecasting into the questions behind an estimate: which categories need closer review, where escalation matters, and how purchasing plans should reflect the materials involved.
For Quotr, this is the connection between cross-trade data and better-informed preconstruction decisions.
UC Berkeley / Study coauthor
Roy W. Carlson Distinguished Professor in Engineering and Director of the Project Production Systems Laboratory (P2SL). Her research spans construction production systems, materials management, supply-chain management, Lean Construction, and artificial intelligence. She is a National Academy of Construction member and received ASCE’s 2024 Construction Management Award. This study’s author contributions include conceptualization, investigation, supervision, visualization, and manuscript review.
Published research / ASCE
The Journal of Construction Engineering and Management is one of ASCE’s flagship publications. The paper identifies the work as part of Quotr AI’s internal research and development. The author team includes Quotr CEO Hanyang Liu, CTO Junzhe Shi, data scientist Boge Lyu, and AI engineer Karthik Yeluripati.
Original AI research, connected to the way construction teams plan, price, and buy.
The paper connects forecasting with practical decisions in budgeting, bidding, and procurement. Applications described in Practical Applications, p. 1.
Estimating
Bring material-price expectations into unit-cost reviews and escalation allowances. Focus attention on the packages most exposed to price changes before the planned purchase.
Put the purchase date into the pricing conversation.
Development
Use material-cost scenarios to review hard-cost assumptions, project timing, and development pro formas. See which categories deserve closer attention before a budget commitment.
Review the drivers, not only the grand total.
Procurement teams
Use the forecast alongside supplier quotes, lead times, and the construction schedule to prioritize repricing, earlier supplier discussions, and price-lock decisions.
Connect what to buy, how much, and when.
05 / Published evidence
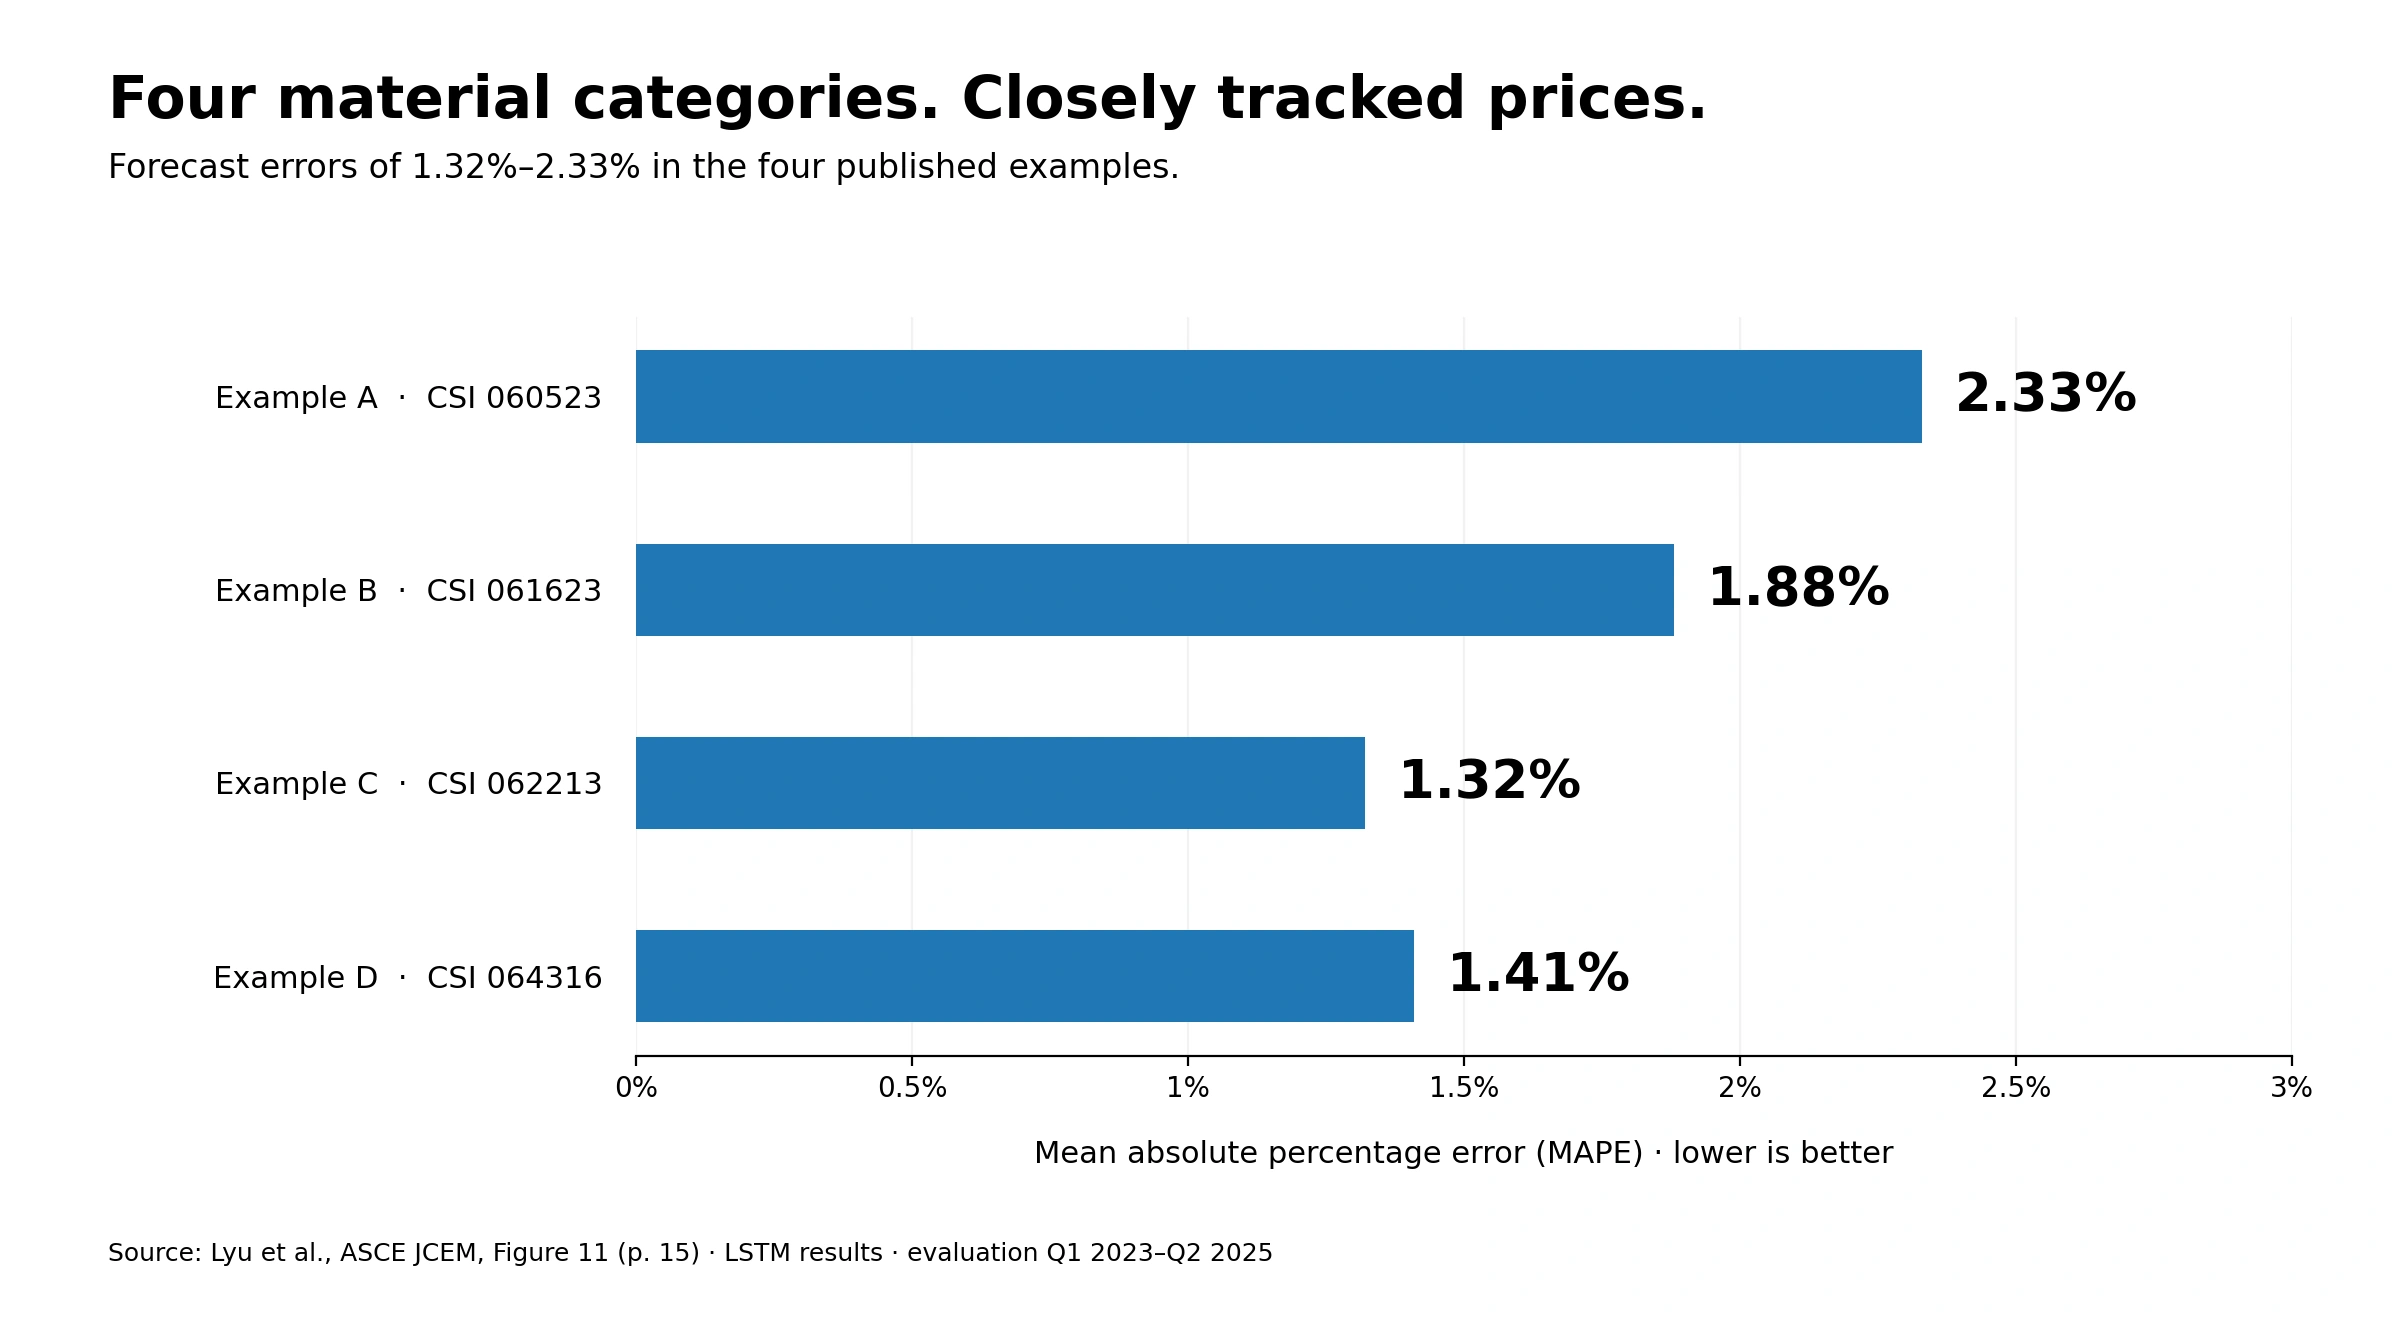
The study’s four published examples report forecast errors from 1.32% to 2.33%. These forecasts cover successive evaluation periods from Q1 2023 to Q2 2025. The model makes a prediction, receives the next observation, and updates before the next forecast.
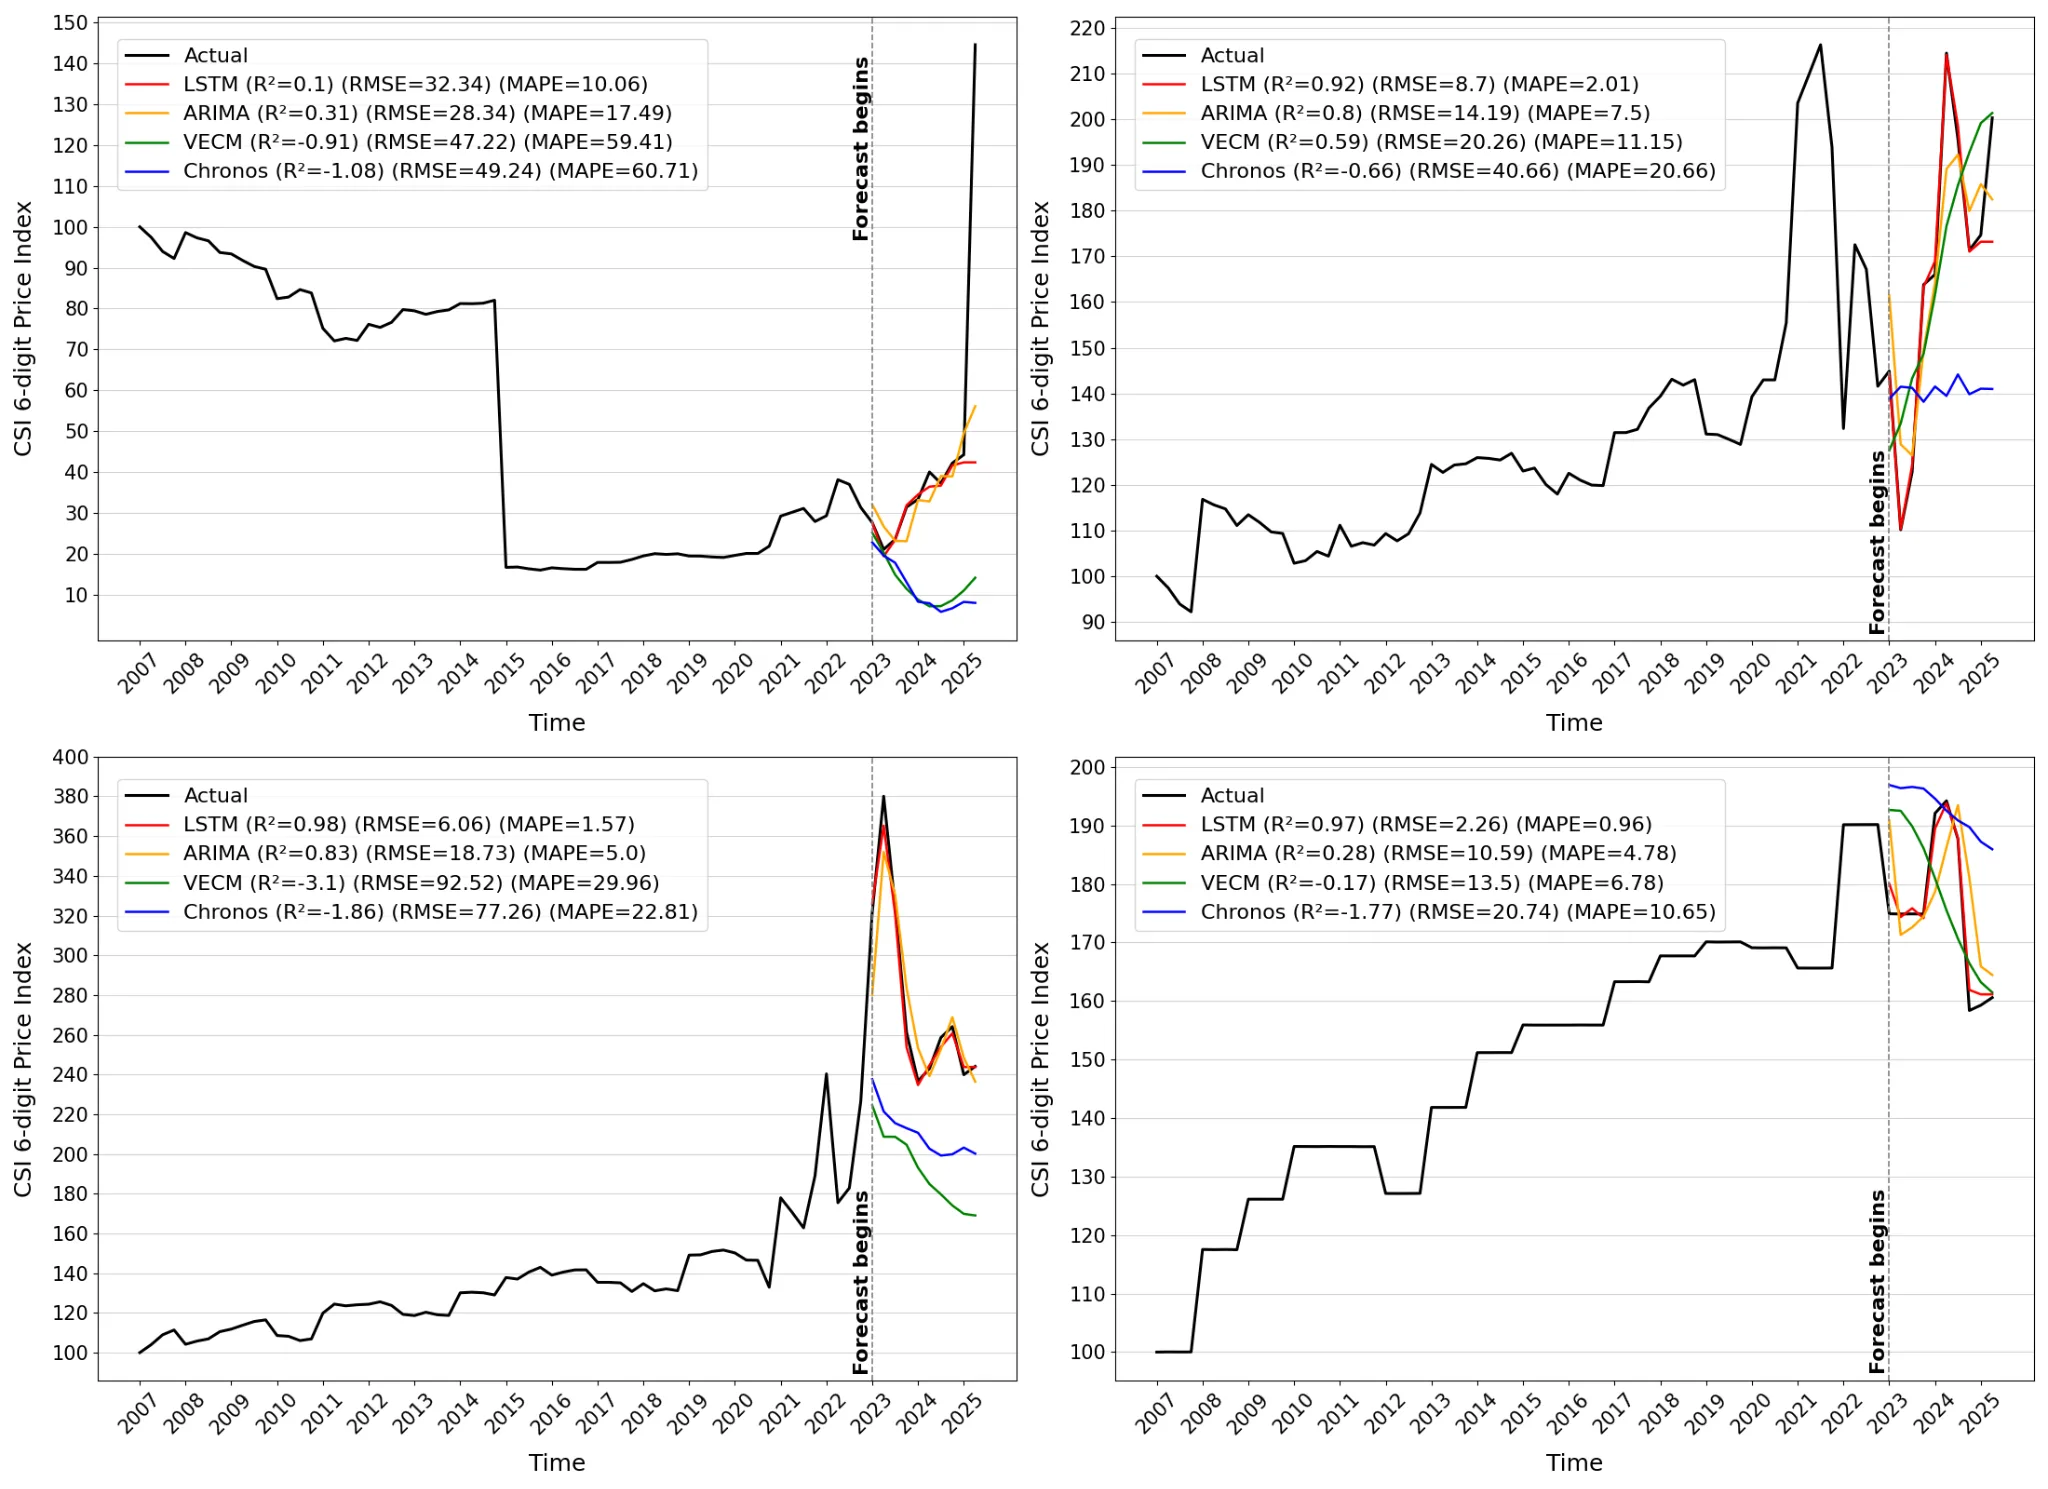
Concrete, lumber, metals, and plastics do not move in lockstep. The paper’s commodity-price histories show why a detailed estimate benefits from a material-specific cost outlook.
A detailed estimate deserves a detailed view of price exposure. Forecasts are organized at the CSI six-digit Section level, so each material category stays connected to its own price history and market signals.
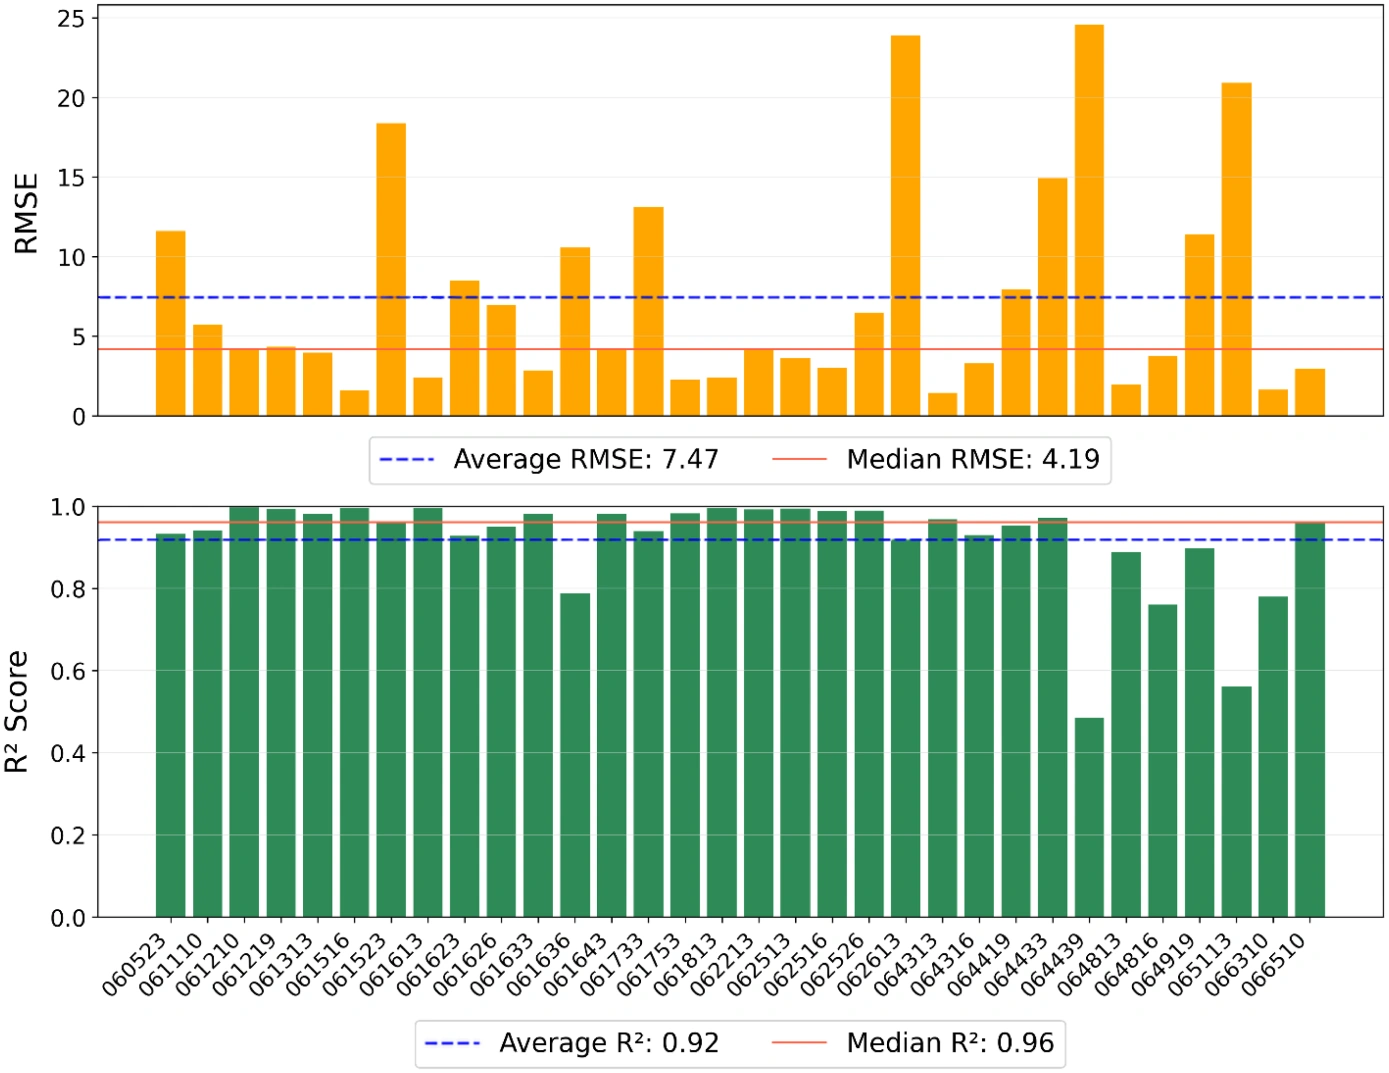
Figure 12 shows the published RMSE and R² results across Division 06 Sections. Table 2 reports a median MAPE of 1.60%, a mean MAPE of 2.36%, and a median R² of 0.96.
For each material Section, MAPE measures the average absolute difference between predicted and observed price-index values as a percentage of the observed value.
The model combines material-price history with producer-price series and macroeconomic indicators. Figure 15 ranks feature contributions for one published example, CSI 060523.
Citation
Boge Lyu, Qianye Yin, Iris Denise Tommelein, Hanyang Liu, Karnamohit Ranka, Karthik Yeluripati, and Junzhe Shi.
Journal of Construction Engineering and Management, 153(1), 04026242 (2027). Published online November 2, 2026. DOI: 10.1061/JCEMD4.COENG-18794.
Figures reproduced or adapted from Lyu et al. under CC BY 4.0.
Still have questions?
Product questions, pricing, or rollout — we'll get back within one business day.
Contact usLive walkthrough
See takeoff, estimates, and bid management tailored to how your team works today.
Schedule demo