
Still have questions?
Talk with our team
Product questions, pricing, or rollout — we'll get back within one business day.
Contact usVisual reporting
Junzhe Shi and Yuan Gan
arXiv:2610.25503
Advancing construction AI from visual recognition to review-ready results.
Preserve the detail. Structure the scope. Put the decision in your hands.
An AI system becomes useful when its findings turn into quantities people can review, price, and approve. Research co-authored by Quotr’s CTO Junzhe Shi and Head of AI Yuan Gan addresses that step: preserving useful visual information as model responses become records, counts, and final answers.
From Seeing to Reporting (FSR) combines a theory of visual reporting with practical inference-time procedures. Across 67,364 model calls, the study examines six vision-language models, including GPT-6.1, Claude Sonnet 5.5, and Gemini 3.8 Flash.
98.8%
Less counting error
Claude Sonnet 5.5, one-call reporting on 50 dense synthetic scenes.
85.2%
Less counting error
GPT-6.1 on the same 50 scenes, still one model call per image.
26.3%
Fewer missed targets
600 GUI-grounding tasks, versus three GPT-6.1 zooms with voting.
01 / The workflow
A marked plan is the starting point. An itemized scope is what the team can act on.
On the drawing, equipment markers and measured routes sit next to the estimate. The estimate separates condensing units, energy recovery ventilators, a makeup air unit, exhaust fans, air devices, duct fittings, and duct runs. Each line carries a quantity, a unit, and its pricing and labor. Approve and Reject leave the next decision with the user.
This is the product connection that makes FSR relevant to Quotr: the value of visual AI depends on how well useful information reaches the final result. A detected item needs a usable record. A set of records needs a consistent quantity summary. An estimate needs enough detail for someone to review and act.
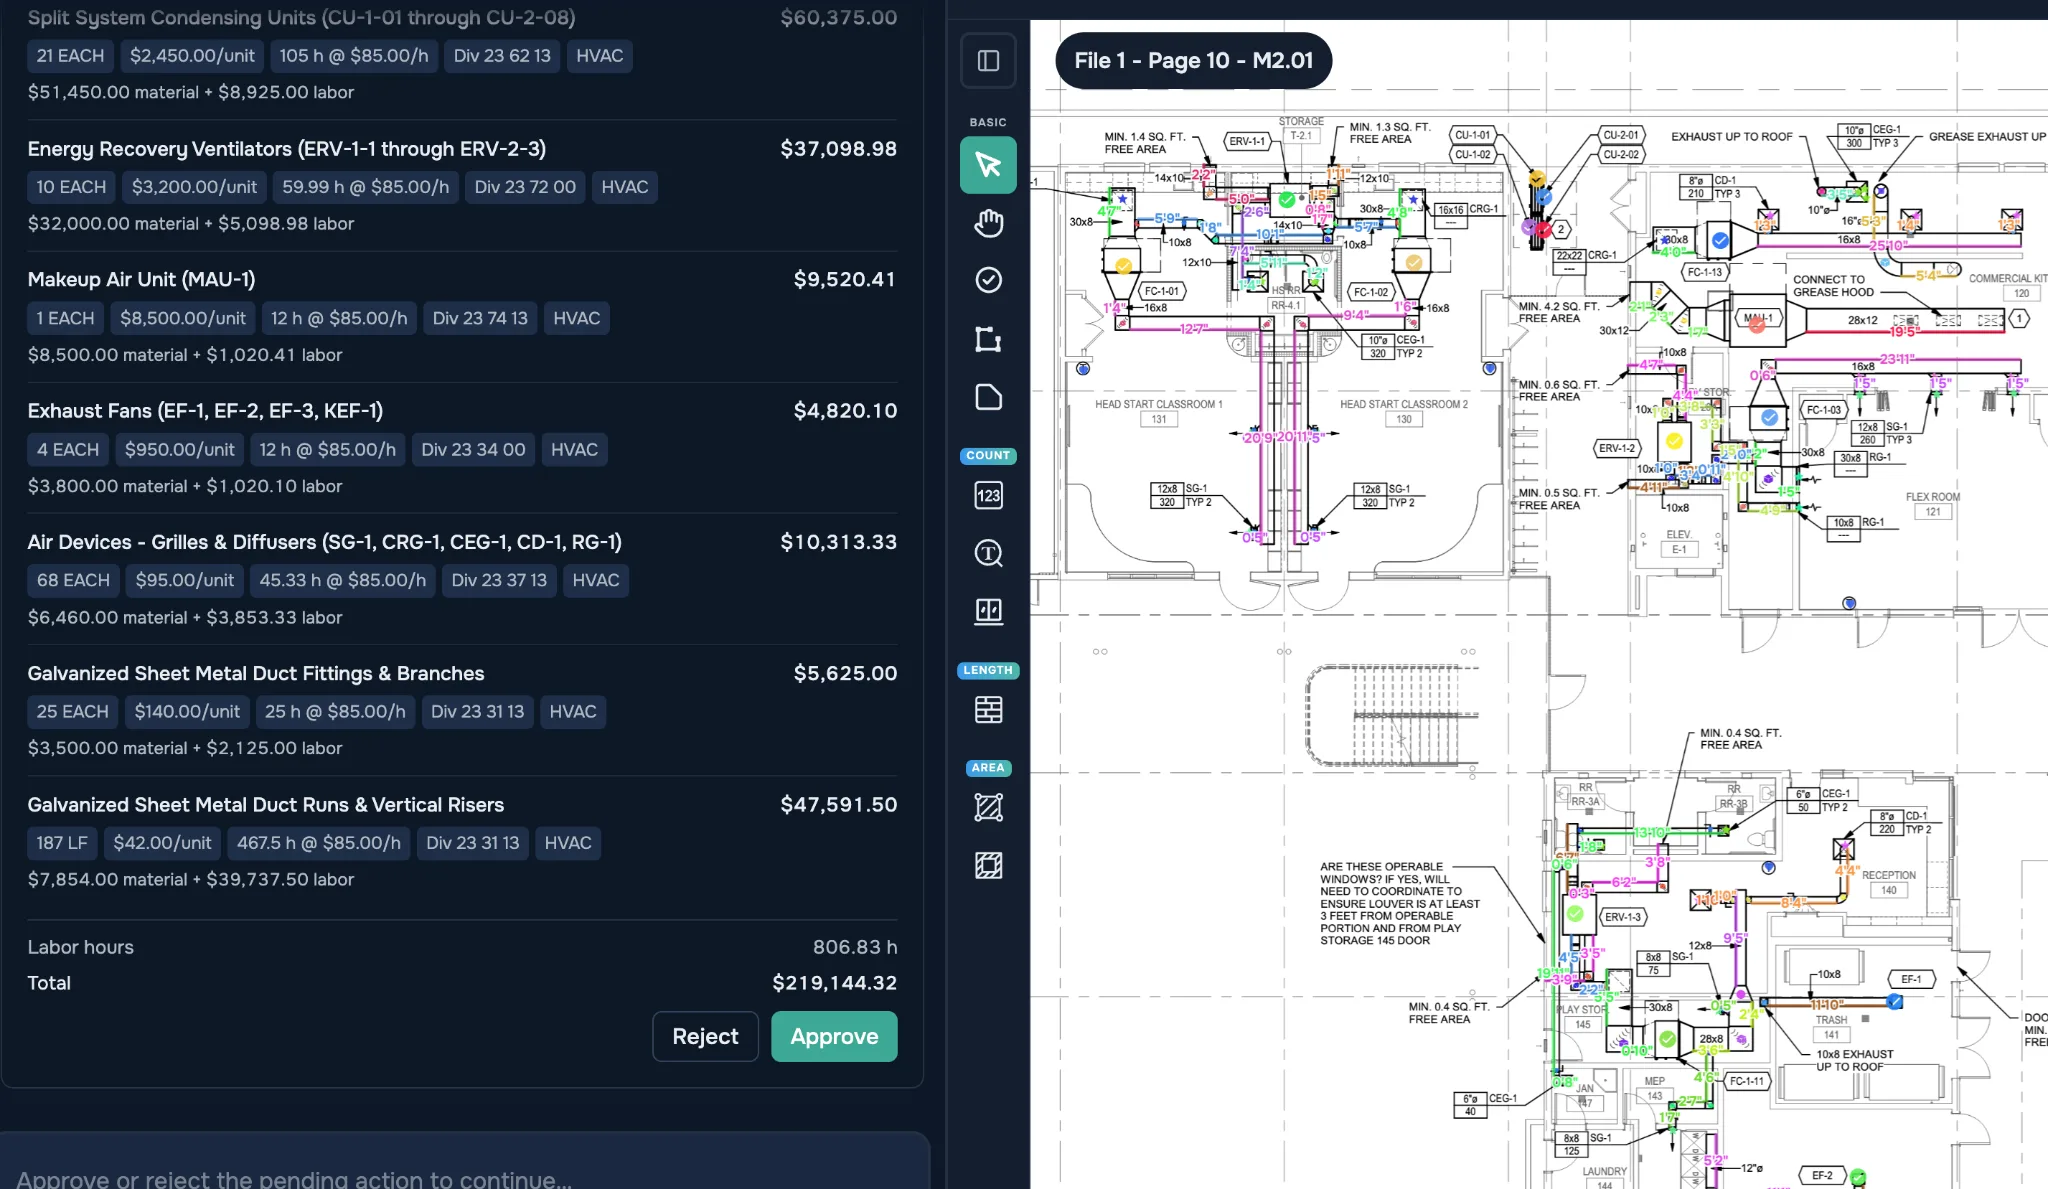
The workspace shows why a construction report needs more than a single total. Equipment is counted in EACH. Duct runs are measured in LF. Material and labor are shown separately, and every line keeps its scope description.
Count the equipment. Measure the routes. Keep the units. Show the cost.
Quotr presents the proposed scope alongside the drawing and gives the user an explicit review step. Quantities, unit prices, labor hours, and line totals are visible before the pending action is approved or rejected.
Turn drawing information into work a construction team can review and use.
02 / The study
Model families evaluated: GPT, Claude, Gemini, and Qwen. Main experiments use GPT-6.1, Claude Sonnet 5.5, and Gemini 3.8 Flash. Additional models appear in the pilot, controlled-scene, and readout experiments.
FSR studies counting, object detection, document layout, screen parsing, and GUI grounding. Its evidence combines controlled comparisons, cross-model experiments, stored responses, and complete-workflow evaluation. Research scope: Sections 1 and 6; Table 6.
The same model weights. A better reporting process.
FSR makes the object list a source for the answer: request the records, decode them, map the task’s declared class aliases, and compute the count. On 50 dense synthetic scenes, the full reporting-and-decoding protocol sharply reduces per-type counting error.
Mean per-type count error on those scenes, lower is better, one model call per image. GPT-6.1 falls from 10.84 to 1.60. Claude Sonnet 5.5 falls from 35.02 to 0.42. Source: Table 8.
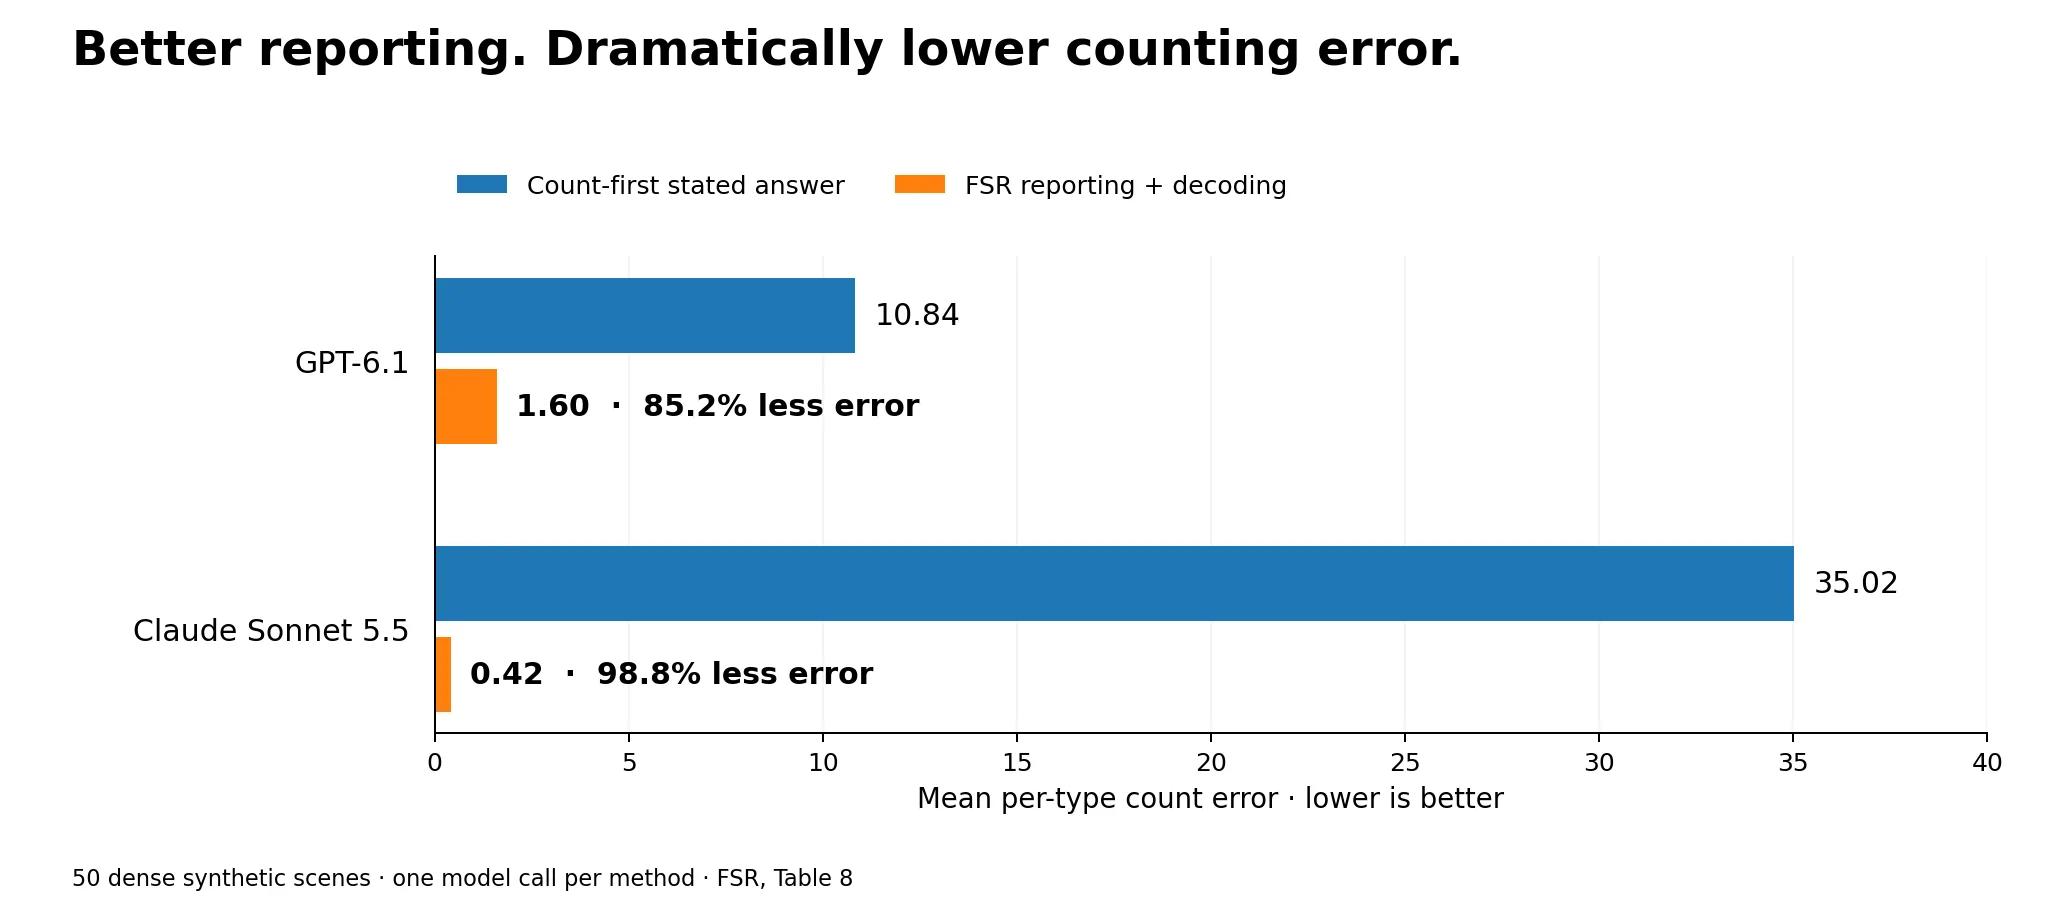
In one example, GPT-6.1 correctly lists 173 objects, while the counts it states in that same response sum to 188. Counting the listed records returns the correct total: 173.
The insight is that better visual AI includes better handling of the information the model has already produced. FSR studies that handling as part of the task itself, connecting responses, records, collections, and final answers. Source: Figure 3.
Model diversity creates options. Effective selection turns them into results.
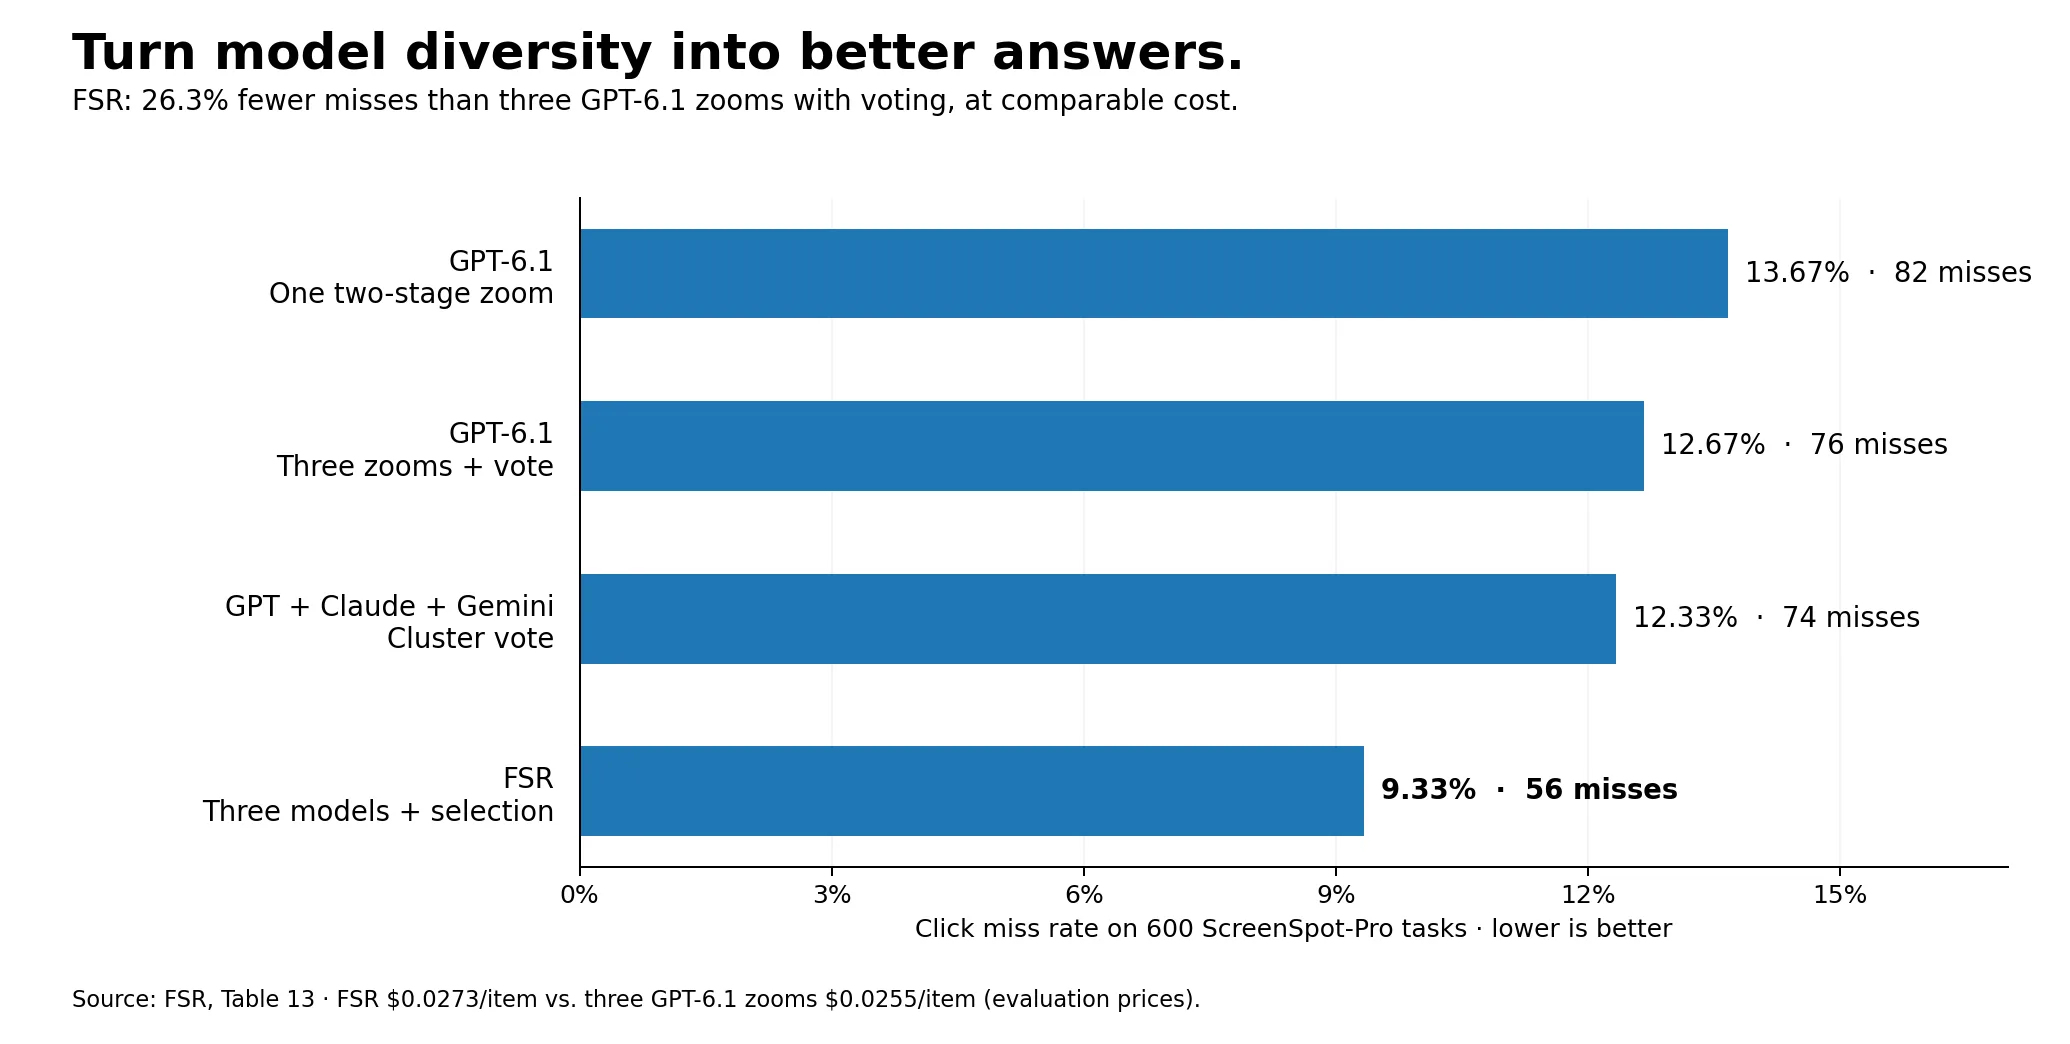
FSR’s GUI-grounding workflow combines candidate click points from GPT-6.1, Claude Sonnet 5.5, and Gemini 3.8 Flash. It scores candidates and compares alternatives when they form different clusters. Given a screenshot and an instruction, the workflow returns the selected point to click.
On 600 ScreenSpot-Pro tasks, FSR selects 544 targets, a 90.67% success rate. Compared with three GPT-6.1 zooms combined by voting, it reduces misses from 76 to 56, a 26.3% relative reduction at comparable evaluation cost. Against voting over the same three models’ candidate points, misses fall from 74 to 56, a 24.3% relative reduction. Source: Table 13.
Finding a correct candidate and delivering it are distinct engineering challenges. FSR connects them.
Responses, then decoded records, then constructed sets, then task answers.
Decode model responses into objects with task-defined classes and locations. Apply declared class mappings and coordinate conventions so software can process the records consistently.
Associate observations and examine how confirmation, record selection, and coordinate averaging change the result. The theory connects each operation with its effect on task error.
Calculate counts from the object list or select a click from the candidate set. The answer depends on a defined collection and readout procedure.
Distinguish between acquiring a correct candidate, retaining it during construction, and choosing it at the end. The analysis identifies where extra views, models, or comparisons can contribute.
The reporting chain and executable procedures are developed in Sections 3–5. The work contributes to visual set generation, visual counting, multi-model selection, and GUI grounding.
An energy recovery ventilator, an exhaust fan, and a grille belong to different scope items. Duct fittings and duct runs use different measurement units. Material costs and labor costs answer different pricing questions.
A construction record can connect an item’s identity and location with its quantity, unit, and calculation inputs. Wall endpoints support length. Room boundaries support area. Specified heights and thicknesses support surface and volume calculations. A drywall area retains its wall system. A duct length retains its system and size. A flooring quantity retains its room and finish assignment.
Measure the work. Preserve its meaning. Report it in the form the estimator needs.
A workflow may inspect the same object through several views or model responses. Turning those observations into an item-level collection is an engineering step of its own. FSR’s study of record association, construction, and selection informs how Quotr reconciles visual observations before they become quantity summaries and cost lines.
The Approve and Reject controls in the HVAC workspace give the user a clear decision point. The product presents the proposed work in a form that can be examined before the next step.
The value is in the handoff: from what the model returns to what the customer can work with.
The HVAC example brings the idea to life. The same record-first approach applies across construction: preserve what each item is, keep its measurement basis, and organize the result for pricing and review.
Keep equipment tags, air-device types, duct dimensions, measured routes, and insulation requirements connected to the relevant scope. Report equipment and fittings as counts, duct runs as lengths, and calculated surfaces in the appropriate units.
From a marked mechanical plan to an itemized scope ready for review.
Separate fixtures, receptacles, switches, data outlets, and equipment by type. Build totals from the item records while preserving standard, GFI, weatherproof, and other specification-driven distinctions.
Device counts that retain the detail needed for pricing and purchasing.
Keep fixture identity, pipe system, material, diameter, and measured length together. Organize quantities by system and size, retaining the units and drawing references that explain the scope.
A material breakdown organized around the actual installation.
Associate sprinkler heads, valves, and equipment with their types and zones. Connect measured piping to the specified sizes and organize the report by system.
A quantity schedule that preserves the composition of the design.
Attach wall type, length, height, openings, faces, and board layers to the wall record. Apply the corresponding construction rules to generate separate board, framing, insulation, and finish quantities.
One wall record. Multiple clearly defined material requirements.
Organize ceiling areas and perimeter conditions by room and ceiling system. Keep insulation thickness, material type, and coverage connected to the relevant surface or assembly.
Coverage and system requirements carried into the quantity report.
Preserve room boundaries and finish assignments as measured areas become coverage and purchasing quantities. Keep perimeter, base, transitions, waste, and packaging conversions explicit.
Room-by-room detail and material-by-material totals from the same records.
Connect element identity with dimensions, thicknesses, and reinforcement details. Calculate and report concrete volume, formwork area, and reinforcement quantities through their respective rules.
Related scope items, each in the unit the contractor needs.
Keep roof surfaces, edges, flashings, penetrations, and drains as distinct scope records. Translate areas and lengths into material requirements using the specified system.
Surface coverage and construction details represented together.
Organize surfaces by room, substrate, and finish system. Retain opening deductions, coat counts, and coverage rates when measured areas become material quantities.
A finish breakdown that explains the work behind every subtotal.
Preserve wall and elevation dimensions, openings, and material types. Connect measured scope to unit sizes and construction details before grouping the material requirements.
An organized masonry schedule built from identifiable wall records.
For steel, connect member marks with section properties and lengths. For openings, connect door or window marks with dimensions, frames, glazing, and hardware schedules. Keep each component’s quantity and unit distinct.
Tagged elements connected to the components required to price and supply them.
Carry zones, alignments, elevations, and section details into the quantity records. Keep excavation volumes, paving areas, curb lengths, and utility quantities organized by location and scope.
A sitework breakdown with the measurement basis intact.
Keep retain, remove, and relocate status attached to the element. Organize quantities by material and area while maintaining the distinction between demolition and replacement scope.
A reviewable scope that carries the project’s decisions into the estimate.
FSR’s research spans object counts, detection records, document layouts, screen elements, and click targets. Its reporting framework and released protocols give researchers and developers tools for studying the information delivered by visual AI systems.
The connection to computer-use agents is concrete: selecting the correct on-screen target is one step in making software automation useful. The study shows how candidate generation and selection can improve that step.
For Quotr, construction is a demanding setting in which to connect visual understanding, structured information, and user-facing decisions.
Better perception creates information. Better reporting makes it usable.
Why VLMs investigates the image scale, content, and decomposition choices that affect what a model can find.
FSR investigates how responses become records, sets, and final answers, and how to improve the information delivered.
Together, these studies connect seeing more effectively with reporting more reliably, supporting Quotr’s research direction from visual understanding to practical preconstruction workflows.
Still have questions?
Product questions, pricing, or rollout — we'll get back within one business day.
Contact usLive walkthrough
See takeoff, estimates, and bid management tailored to how your team works today.
Schedule demo